 LIVE CHAT
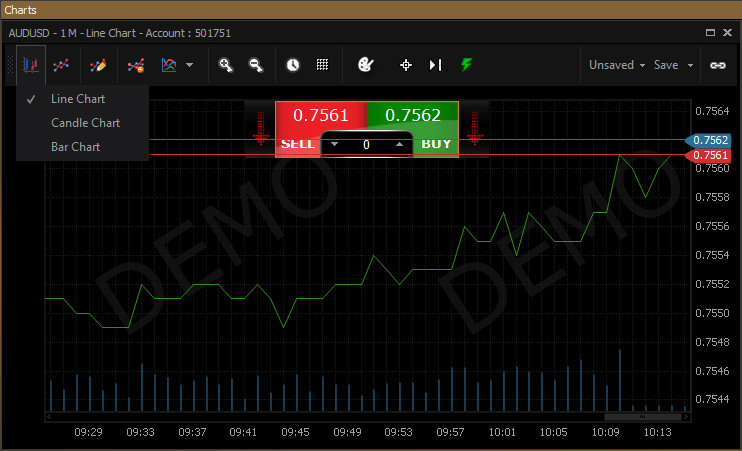
The AX1 trader software allows three different types of charts.
LINE CHART
The Line Chart is a type of chart that displays the information as a series of data points that are connected by a straight line segments and shows how some particular data changes at different equal intervals of time. The Line Chart uses only the corresponding closing prices for a given time-frame.
CANDLE CHART
The Candle Chart is a type of chart that shows all the prices i.e. opening, high, low and closing price for the corresponding time-frame.
If a candle bar represents that the close is lower than the open then the real body is filled. And the real body is transparent if the close price is higher than the open price.
The thin lines above and below the real body are known as the shadows. They are also known as candlestick wicks. The peak of the upper shadow is the highest price for that time-frame and the bottom of the lower shadow is the lowest price for that time-frame.
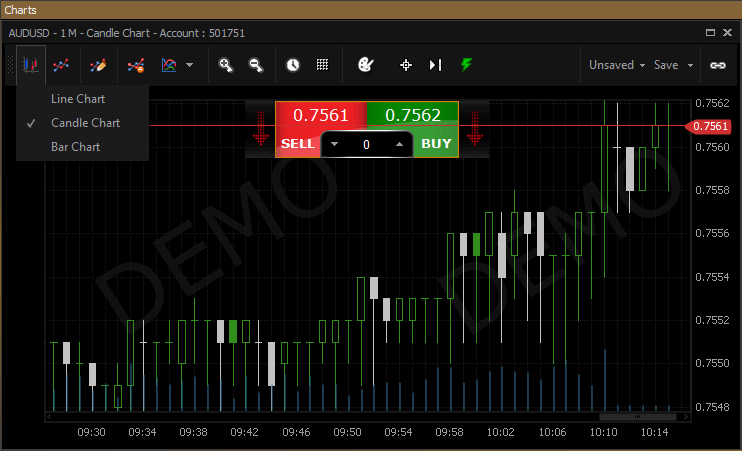
Bullish Candle
Bullish Candle is depicted by the green colour candle where the closing prices are higher than the opening prices.
Bearish Candle
Bearish Candle is depicted by the white colour candle where the opening prices are higher than the closing prices.
BAR CHART
Bar Chart is a type of chart style that depicts all the prices i.e. opening price, high price, low price and closing price.
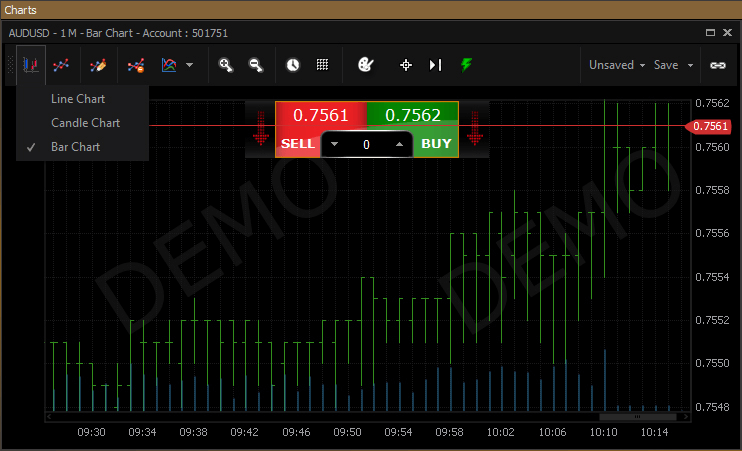
In a bar, the left line mark indicates the opening price at a time-frame whereas the right line mark depicts the closing price at a time-frame. Hence, the top of the vertical line indicates the highest price during the time frame and the bottom of the vertical line indicates the lowest price.